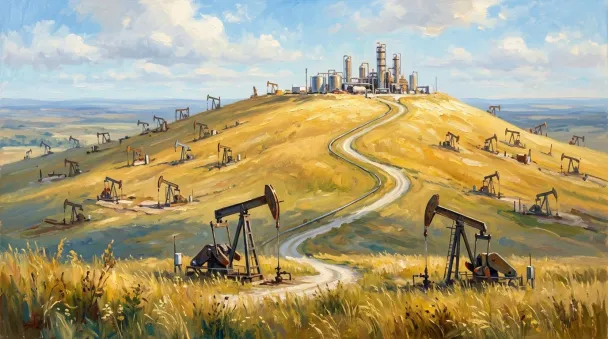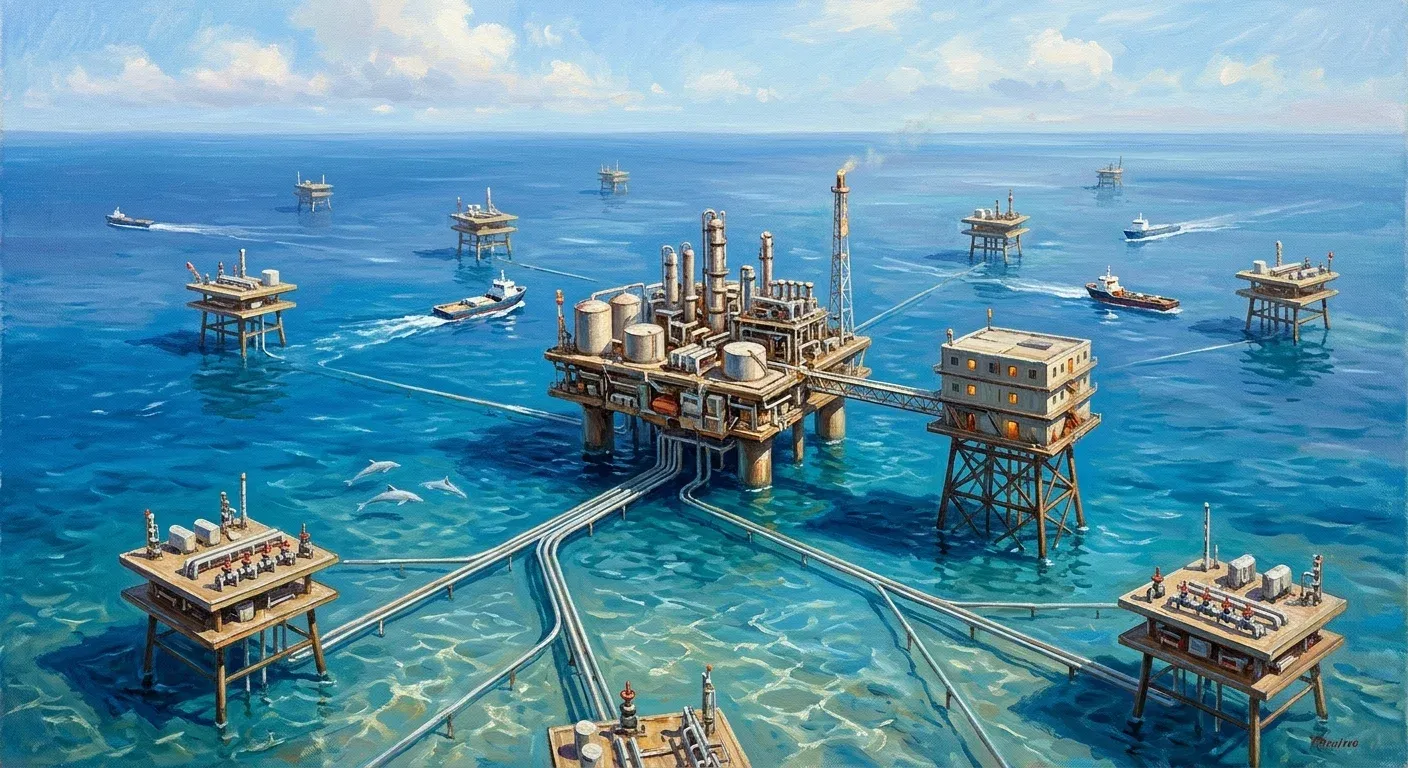
In the offshore oil and gas industry, precision and efficiency can translate into millions of dollars in savings. This is the story of how I built a Python-based modeling tool that helped Chevron, one of the world’s largest energy companies, streamline offshore pipeline design, ultimately cutting $49.8 million from their investment plan.
The Problem: Manual Data Transfer in a Complex Offshore Network
In Chevron’s offshore operations, we model pipeline networks that connect platforms across vast ocean fields. These networks determine how oil and gas are transported from remote extraction points to central processing hubs.
We use specialized petroleum simulation software to evaluate different pipeline configurations, but the process was severely limited by a manual step: transferring data from Excel into the simulation system.
Pipeline network data was stored in Excel spreadsheets, and engineers had to manually copy that data into the simulation environment. This process was:
- Time-consuming: every design iteration restarted with hours of hand copying
- Error-prone: a single mistyped pipeline length could invalidate an entire simulation run
- Inflexible: comparing multiple design scenarios meant repeating the whole transfer for each one
Warning
Manual transfer made it nearly impossible to explore optimal configurations. When the investment plan required evaluating dozens of network layouts, the bottleneck was not engineering judgment, it was keyboard time.
The Structure: A Tree-Based Pipeline Network
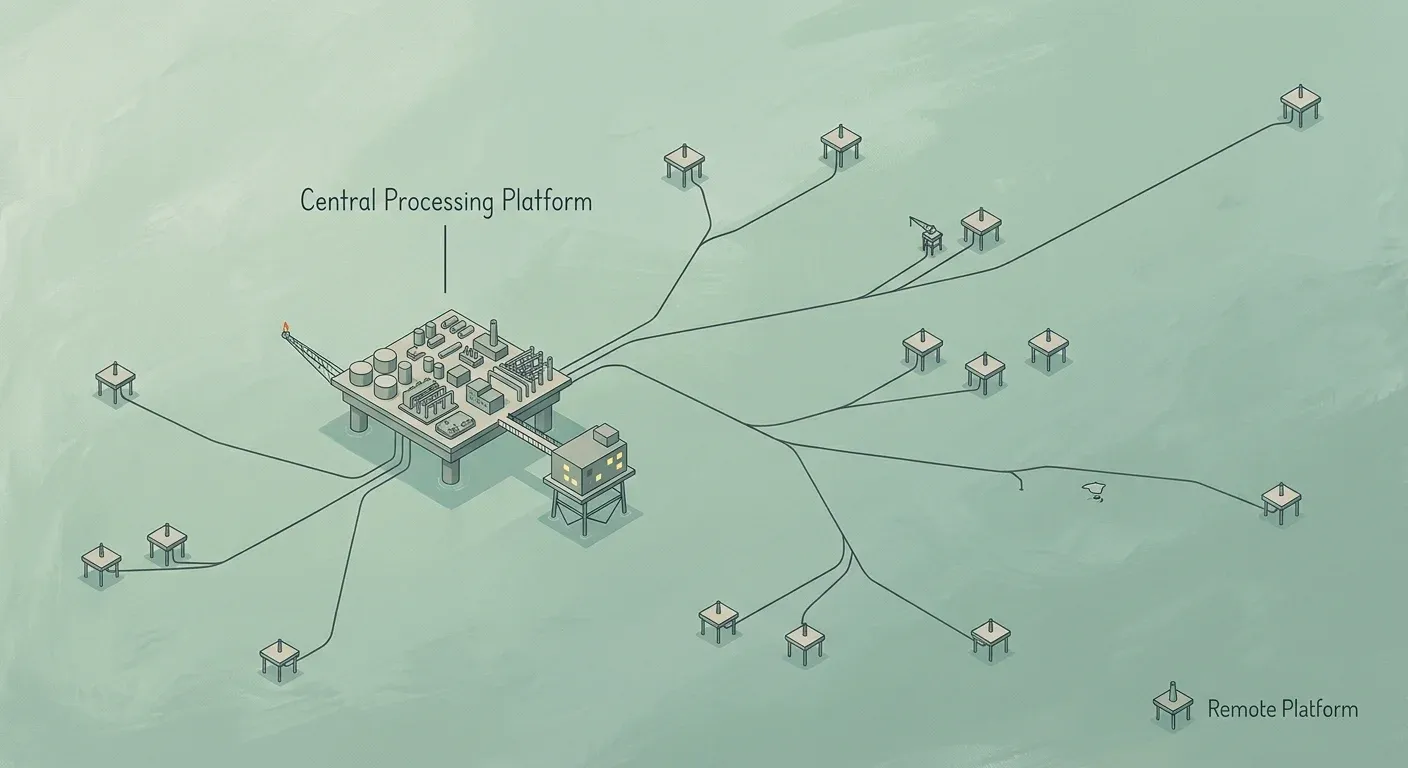
Tree (graph theory): a connected structure with one root and no cycles. Every node can be reached from the root by exactly one path.
Offshore pipeline architecture is naturally a tree. Fluids produced at the remote platforms always flow toward one processing hub, so there is never a loop. In this structure:
- Nodes represent offshore platforms, which fall into two categories:
- Central Processing Platform (CPP): the root node, where all produced fluids are processed.
- Remote Platforms (RPs): leaf or intermediate nodes that route fluids to the CPP.
- Edges represent pipeline segments that connect the platforms.
Modeling the system as a tree structure made it easier to validate the network, run simulations, and apply search algorithms to find the most efficient configuration. In code, the network was just two collections:
# platforms: id -> role ("CPP" or "RP")
nodes = {
    "CPP": {"role": "CPP"},
    "RP1": {"role": "RP"},
    "RP2": {"role": "RP"},
    "RP3": {"role": "RP"},
}

# pipeline segments: (from, to) pairs, always pointing toward the CPP
edges = [("RP1", "CPP"), ("RP2", "RP1"), ("RP3", "RP1")]
This graph-based representation, a list of nodes and edges, was flexible enough to model both the topology and the operational behavior of the system.
The Solution: A Python Automation and Modeling Framework
To solve the problem, I developed a custom software tool using Python that:
1. Extracted and structured pipeline data from Excel
Spreadsheet rows became typed objects: platforms, pipeline segments, fluid properties. Reading the workbook directly removed the manual transfer step entirely, and with it the transcription errors.
2. Represented the network as a graph with a tree topology
The parsed nodes and edges were assembled into a tree rooted at the CPP. Validation came for free from the structure: any platform unreachable from the root, any cycle, any duplicated segment flagged immediately.
3. Automatically transferred data into the simulation software
The tool wrote the validated network straight into the simulator’s input format, so what used to be an afternoon of copying became a single automated step.
4. Enabled batch scenario modeling and analysis
Because nothing needed a human in the middle, the tool could sweep through configurations in bulk, building and evaluating hundreds of network scenarios in one run.
flowchart LR
    xlsx[Excel spreadsheets] --> parse[Python parser]
    parse --> tree[Tree model]
    tree --> sim[Simulation software]
    sim --> report[Scenario results]
The Results: Significant Business Impact
Note
The Python tool produced measurable and transformative outcomes, headlined by $49.8 million in savings across the evaluated pipeline network.
- $49.8 million saved through optimized pipeline layouts and reduced capital investment
- Significant reduction in engineering workload, allowing teams to focus on analysis instead of manual data handling
- A scalable framework that can be reused and extended for future offshore projects
Final Thoughts
This project was more than an automation task: it was a redesign of how offshore pipeline modeling is approached. By combining domain expertise with Python’s flexibility, I was able to transform a manual, error-prone workflow into a fast, reliable, and scalable system.
The success of this tool reinforces a broader lesson: when you deeply understand a system’s structure, in this case a tree-based offshore pipeline network, you can design software that unlocks real operational and financial value.